
Are you running Google Ads or Meta Ads campaigns for your ecommerce business? Are you planning to increase your advertising budget to generate more sales?
If yes, there is one important thing you should understand before making that decision.
More sales do not always mean more profit.
Imagine you are running an e-commerce store that sells clothing, accessories or skincare products.
Your advertising campaigns are performing well and you decide to increase the budget.
Within a few weeks, you start receiving more orders. Your revenue also increases.
Sounds great, right?
But when you calculate your product costs, shipping charges, discounts, returns and advertising expenses, you notice something surprising.
Your business is keeping less money than before.
How is that possible?
This is one of the challenges businesses face while scaling performance marketing for ecommerce.
Many marketers concentrate on increasing revenue and maintaining a good Return on Ad Spend (ROAS). However, a healthy ROAS does not automatically mean your business is making a healthy profit.
Note: The financial examples in this article are hypothetical. They are designed to explain the calculations and do not represent actual client campaign results.
In this article, I will explain how to calculate your advertising spending limits, understand break-even ROAS, identify profitable products and scale your Google Ads and Meta Ads campaigns without ignoring business costs.
Let us get started!
How to Scale Ecommerce Ads Profitably
To scale ecommerce advertising profitably, you need to understand how much money each order contributes before advertising expenses.
Once you calculate your product costs and other variable expenses, you can decide how much you can afford to spend on advertising.
Then, increase your budgets through controlled tests and measure whether the additional spending is generating enough value for your business.
Remember, the objective is not simply to increase revenue. It is to grow your business while maintaining acceptable margins, cash flow and profitability.
What Does Profitable Scaling Mean in Ecommerce?
Before understanding advertising budgets, let us understand what profitable scaling means.
Imagine you have two ecommerce stores.
The first store generates ₹10 lakh in monthly revenue but keeps very little money after paying its expenses.
The second store generates ₹8 lakh in revenue but has much better margins and manages its expenses carefully.
Which business is performing better?
You cannot answer that question by looking only at revenue.
You also need to understand the costs and the money remaining after those costs.
This is where a few important financial terms come into the picture.
Revenue, Gross Profit, Contribution and Net Profit
Revenue: The money generated through sales, based on the reporting definition you follow.
Net sales: Sales after relevant discounts, returns and other adjustments, using a consistent business definition.
Cost of Goods Sold (COGS): The direct cost of the products you sell.
Gross profit: The money remaining after subtracting the Cost of Goods Sold from sales.
Contribution before advertising: The money remaining after subtracting product costs and other non-advertising costs that change with sales.
Contribution after advertising: The amount remaining after deducting advertising expenses from the contribution before advertising.
Net profit: The amount remaining after accounting for all applicable expenses under your business’s accounting method.
Have a look at this simple calculation.
Net sales → Product costs → Other variable costs → Advertising expenses → Contribution after advertising → Fixed business expenses → Operating profit.
For example, your business may still need to pay office rent, salaries and software subscriptions from the contribution remaining after advertising.
Therefore, contribution after advertising should not be presented as net profit.
Decide What You Want to Achieve
Before increasing your advertising budget, ask yourself:
- Do I want to generate more total contribution?
- Do I need to maintain a minimum amount from every order?
- How much can I afford to spend on acquiring a new customer?
- Will my existing customers purchase again?
- Does my business have enough cash to support higher advertising spending?
These questions will help you make a more informed decision.
My suggestion: Decide your financial target before deciding your advertising budget.
How Much Can You Afford to Spend on Customer Acquisition?
This is one of the most important calculations for ecommerce businesses.
You might be wondering how much you can spend to generate an order.
Should you spend ₹200, ₹500 or ₹1,000?
There is no fixed answer for every business.
It depends on your product’s selling price and the expenses involved in fulfilling the order.
Step 1: Calculate Contribution Before Advertising
Use this simple formula:
Contribution before advertising = Net sales per order − Non-advertising variable costs per order
Non-advertising variable costs can include product costs, packaging, shipping expenses paid by the business, payment processing fees and expected costs associated with returns.
You should account for these costs consistently.
For example, if refunds have already been deducted from net sales, do not deduct them again.
Step 2: Calculate the Advertising Cost You Can Afford
Let us understand this with an example.
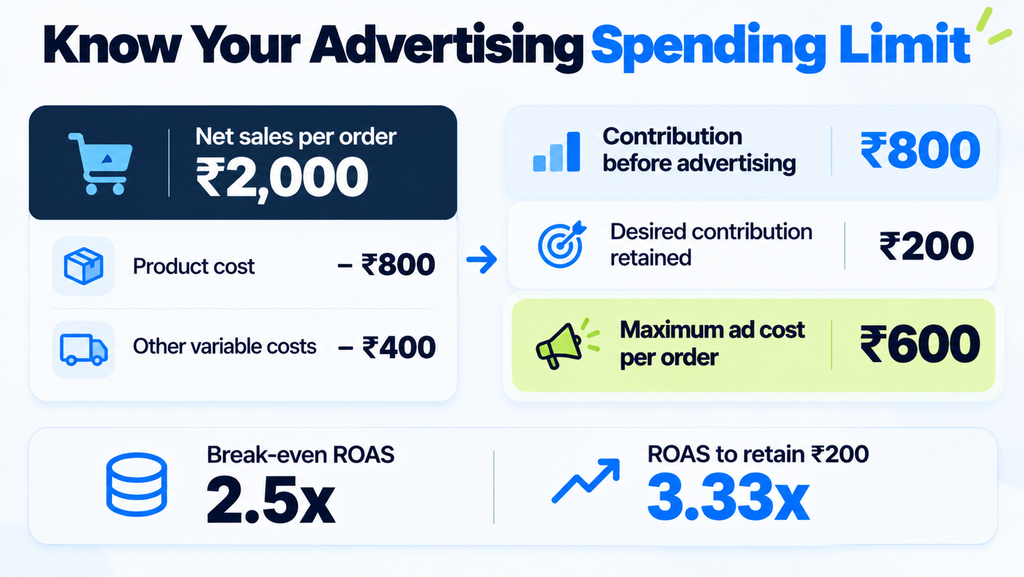
Suppose you sell a product for ₹2,000.
| Particulars | Amount per order |
|---|---|
| Net sales | ₹2,000 |
| Product cost | ₹800 |
| Other variable costs | ₹400 |
| Contribution before advertising | ₹800 |
| Desired contribution after advertising | ₹200 |
| Maximum advertising cost per order | ₹600 |
Now, let us calculate.
₹2,000 − ₹800 − ₹400 = ₹800
Your business has ₹800 remaining before advertising.
But this does not mean you should spend the entire ₹800 on advertisements.
Suppose you want to retain at least ₹200 per order to help cover fixed expenses and contribute towards profit.
Then:
₹800 − ₹200 = ₹600
Therefore, your advertising cost should not exceed ₹600 per order under these assumptions if you want to preserve ₹200 contribution.
If you spend ₹800, your contribution after advertising becomes zero.
If you spend ₹900, your contribution after advertising becomes negative ₹100.
This is why calculating your advertising limit is important.
One more thing.
Advertising cost per order is not automatically the same as Customer Acquisition Cost (CAC).
Cost per order looks at the advertising cost associated with generating orders. Customer Acquisition Cost measures the cost of acquiring new customers under a defined calculation, which may also include other marketing and sales expenses.
A returning customer can place another order without being a newly acquired customer.
Step 3: Calculate Your Break-Even ROAS
Return on Ad Spend is a commonly used metric in performance marketing.
It helps you understand how much attributed revenue your advertisements generate compared with advertising spending.
The formula is:
ROAS = Attributed revenue ÷ Advertising spend
For example, if you spend ₹10,000 and your campaign reports ₹40,000 in attributed revenue, the ROAS is 4.0x.
But is 4.0x a good ROAS?
That depends on your costs.
In our ₹2,000 order example, contribution before advertising is ₹800.
Therefore:
Pre-advertising contribution margin = ₹800 ÷ ₹2,000 × 100 = 40%
The formula for zero contribution after advertising is:
Break-even ROAS = 1 ÷ Pre-advertising contribution margin
So:
1 ÷ 0.40 = 2.5x
At 2.5x ROAS, advertising spending would use the entire contribution available before advertising.
There would be nothing left from those orders to cover fixed business expenses.
Now, remember that we wanted to retain ₹200 per order.
Our maximum advertising spending was ₹600.
Therefore:
₹2,000 ÷ ₹600 = 3.33x
This means the target becomes approximately 3.33x to preserve ₹200 contribution per order.
These calculations assume that sales and advertising values use comparable definitions and that the product mix and cost percentages remain stable.
Remember: Your break-even ROAS is not automatically your whole-business break-even point.
Why a Good ROAS Does Not Always Mean More Profit
Now comes the most interesting part.
Many marketers increase advertising budgets when campaigns are generating a good ROAS.
But have you checked what happens to the money remaining after that increase?
Let us understand with another example.
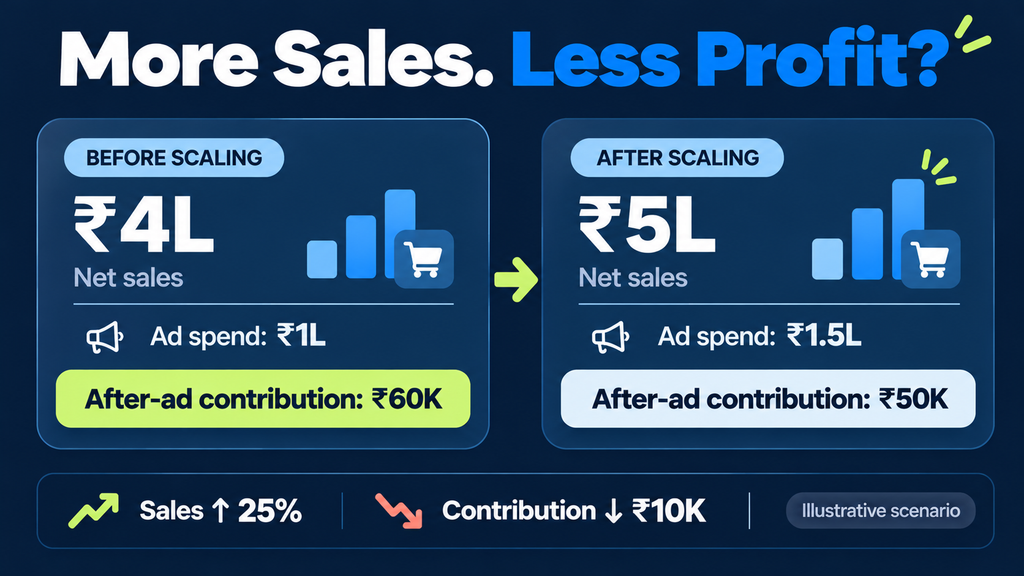
Suppose an ecommerce business is spending ₹1 lakh every month on advertising.
It generates ₹4 lakh in net sales.
The business has a 40% contribution margin before advertising.
Now, the marketing team increases the advertising budget to ₹1.5 lakh.
The business starts generating ₹5 lakh in sales.
At first, this looks like a good improvement.
Have a look at the numbers.
| Metric | Before increasing budget | After increasing budget |
|---|---|---|
| Advertising spend | ₹1,00,000 | ₹1,50,000 |
| Net sales | ₹4,00,000 | ₹5,00,000 |
| Revenue-to-advertising-spend ratio | 4.0x | 3.33x |
| Contribution before advertising | ₹1,60,000 | ₹2,00,000 |
| Contribution after advertising | ₹60,000 | ₹50,000 |
The revenue increased by ₹1 lakh.
But contribution after advertising decreased from ₹60,000 to ₹50,000.
How did that happen?
The business spent an additional ₹50,000 on advertisements.
The additional ₹1 lakh in sales generated ₹40,000 in contribution before advertising, assuming the same 40% margin.
So:
₹40,000 − ₹50,000 = −₹10,000
The business recorded an increase in sales but a decrease of ₹10,000 in contribution after advertising.
This is why looking only at total revenue or average ROAS can be misleading.
Understand the Return from Additional Spending
You should also evaluate what happened when you increased the budget.
A useful calculation is:
Observed marginal return = Change in revenue ÷ Change in advertising spend
In our example:
₹1,00,000 ÷ ₹50,000 = 2.0x
The observed marginal revenue-to-spend ratio was 2.0x.
However, remember that this calculation only compares what happened before and after the budget change.
It does not prove that the advertisements caused all the additional sales.
Seasonal demand, discounts, promotions, other marketing campaigns and product availability might have influenced revenue.
To understand the actual effect of additional advertising, use a controlled test where possible.
My suggestion: Before increasing your next campaign budget, calculate whether the additional spending is likely to produce sufficient contribution.
Is Your Ecommerce Business Ready to Scale Advertising?
Even if your campaigns are performing well, your business should be ready to handle additional demand.
For example, imagine your advertising campaigns generate hundreds of new orders.
But what happens if you do not have enough products in stock?
Or what if the delivery team cannot process the additional orders?
You might end up disappointing customers despite spending more money on advertising.
Before scaling, check three important areas.
1. Measurement Readiness
Make sure your website and advertising platforms are recording purchase information correctly.
Check whether:
- Purchase tracking is working as intended.
- Purchase values and currencies are correct.
- Refunds and cancellations are handled consistently.
- New and returning customers can be identified where needed.
- Advertising platform revenue is not confused with total business revenue.
Google Ads and Meta Ads may both assign credit to the same purchase under their respective attribution settings.
Therefore, adding their reported revenue does not necessarily represent unique business sales.
2. Financial Readiness
Before increasing spending, review:
- Product margins
- Shipping and packaging expenses
- Payment charges
- Discounts
- Expected returns
- Advertising spending limits
- Available cash
Having a positive ROAS does not mean your business has enough money to keep increasing advertising budgets.
3. Operational Readiness
Your business should also have:
- Sufficient inventory
- Reliable delivery arrangements
- Customer support capacity
- A process for handling returns
- Enough working capital
Remember: Advertising can increase demand, but it cannot automatically solve problems in your inventory or operations.
Which Ecommerce Products Should You Scale First?
If you are selling multiple products, should you increase advertising spending on your bestselling product?
Not always.
A product that generates high revenue may also involve high costs.
For example, one product might sell for ₹3,000 but require ₹2,500 in product and fulfilment costs.
Another product might sell for ₹2,000 but cost only ₹1,000 to fulfil.
Which product provides more room for advertising?
The second product could be more attractive, depending on conversion rates, returns and other business factors.
Check Product-Level Contribution
Before deciding which products to promote more aggressively, review:
- Selling price and net sales
- Product cost
- Fulfilment and shipping costs
- Contribution per order
- Conversion performance
- Return and cancellation rates
- Stock availability
- Repeat-purchase behaviour
This helps you identify products that have enough room to support additional customer acquisition.
Compare Discounts and Product Bundles
Imagine you are selling a skincare product.
You have three options:
- Sell one product at its regular price.
- Offer a discount on that product.
- Create a bundle containing two or three products.
A bundle may increase Average Order Value (AOV), which means the average revenue generated per order.
But does a higher order value automatically mean more contribution?
No.
You still need to subtract the additional product, packing, shipping and other costs.
Sometimes, a bundle can improve contribution.
In other situations, a large discount can reduce the money remaining from the sale.
So, always calculate the contribution instead of selecting offers based only on revenue.
Use Google Ads Product-Level Reporting
Google Ads offers a feature called conversions with cart data.
When configured correctly, it can provide additional information about the products purchased after customers interact with advertisements.
By combining cart data with Cost of Goods Sold information from Google Merchant Center, advertisers can access product-level revenue and gross-profit reporting.
However, this requires suitable tracking and product information to be available.
Also, the gross-profit figure shown in Google Ads does not automatically account for all shipping costs, payment charges, returns, advertising expenses or fixed operating costs.
Therefore, you still need your own business contribution calculations.
You can learn more from Google’s official guide on conversions with cart data.
How to Increase Google Ads and Meta Ads Budgets Without Unnecessary Risk
Now that you understand product margins and advertising limits, let us discuss how to increase your campaign budgets.
You might have heard suggestions like increasing the budget by 20% every three days.
But should every ecommerce business follow the same rule?
Not necessarily.
A budget increase that is suitable for one business may not be suitable for another.
For example, a business with large margins and sufficient inventory can afford a different level of risk from a business with limited cash and narrow margins.
That is why I recommend using a controlled budget-scaling test.
Prepare a Budget-Scaling Plan
Before making changes, document the following details.
| Item | What to include |
|---|---|
| Business objective | Why you want to increase advertising |
| Campaign or product | What you want to scale |
| Current performance | Spending, sales and contribution before the change |
| Proposed change | The exact budget adjustment |
| Additional spending limit | Maximum additional amount you are willing to spend |
| Success metric | Additional contribution and relevant acquisition measures |
| Review period | When the results will be evaluated |
| Stop condition | When you will reduce or stop the test |
| Responsible person | Who will monitor and approve the decision |
This process does not need to be complicated.
You can maintain it in a simple Google Sheet.
Follow These Six Steps
Step 1: Understand your existing performance.
Review the current advertising spend, conversions, revenue and contribution.
Step 2: Decide what you want to improve.
For example, you may want to generate more orders for a product that has healthy margins.
Step 3: Make a planned change.
Increase the budget within the financial limit you have agreed upon.
Avoid making several unrelated changes simultaneously where possible.
Step 4: Monitor the important metrics.
Check spending, conversions, product availability and any unexpected changes.
Step 5: Wait for meaningful results.
Some purchases happen several days after the initial advertising interaction.
Make sure the reporting period includes sufficiently mature conversion information before reaching a conclusion.
Step 6: Make the next decision.
Based on the evidence, you can increase the budget further, maintain it, revise the campaign or reduce spending.
My suggestion: Do not scale a campaign simply because the platform recommends spending more. Check whether the business can benefit from the additional investment.
How to Connect Google Ads and Meta Ads Performance to Business Profit
Google Ads and Meta Ads provide several metrics to help marketers understand campaign performance.
For example, you can analyse advertising spend, conversions, conversion value and ROAS.
These numbers are useful for campaign optimisation.
However, they do not automatically represent your complete business profit.
Understand What Google Ads Is Optimising
Google Ads can use conversion values to help optimise campaigns.
For example, conversion values may represent sales revenue or values based on profit margins, depending on the setup.
Google explains this in its official guide on conversion values.
But there is one important point.
Google Ads works with the conversion information and goals you provide.
If you send purchase revenue as the conversion value, the platform does not automatically know your complete fulfilment costs and business expenses.
Similarly, if your conversion values are based on margins rather than revenue, you should label and interpret the resulting performance metrics accordingly.
Use Different Reports for Different Decisions
I recommend looking at three reporting views.
Advertising platform reports: Understand campaign performance according to the platform’s conversion and attribution settings.
Website analytics: Understand recorded website purchases and customer behaviour, while considering tracking limitations.
Business or finance reports: Understand actual business revenue, costs and contribution according to your agreed reporting method.
When making larger budget decisions, compare these views rather than relying on only one dashboard.
Remember: A strong campaign ROAS is useful, but contribution after advertising tells you more about what remains for the business.
Should You Accept a Loss on the First Ecommerce Order?
This is another important question, especially for businesses that sell products customers purchase regularly.
For example, a customer might purchase skincare products every month.
Another customer might buy clothing or accessories multiple times throughout the year.
If customers return and purchase again, a business may decide to spend more to acquire them initially.
But is it always a good strategy?
No.
It depends on actual repeat-purchase behaviour and the money the business earns from those orders.
Understand Customer Lifetime Value
Customer Lifetime Value (LTV) refers to the value a customer generates over the period they remain a customer.
You should distinguish revenue-based lifetime value from contribution-based lifetime value.
For example, a customer might generate ₹10,000 in revenue through repeated purchases.
But after product costs, fulfilment and other variable expenses, the contribution could be much lower.
That contribution is more useful when deciding whether expensive customer acquisition is financially sustainable.
Check Your Customer Acquisition Payback Period
The customer acquisition payback period is the time required to recover the cost of acquiring a customer.
Suppose your business spends ₹700 to acquire a new customer.
The first order generates only ₹500 in contribution before considering that acquisition cost.
You need an additional ₹200 in contribution to recover the acquisition expense.
If the customer makes another purchase that generates enough contribution, the acquisition cost may eventually be recovered.
But what if the customer never returns?
The business may not recover that initial expense.
Therefore, do not assume repeat purchases will happen without supporting data.
Look at groups of customers acquired during different periods and check how many actually return.
Shopify also explains how businesses can calculate customer acquisition costs.
My suggestion: Accepting a first-order loss should be a planned business decision supported by retention data, financial limits and adequate cash flow.
When Should You Scale, Hold, Fix or Stop an Ecommerce Campaign?
We have discussed several factors that influence profitable ecommerce growth.
But how do you put everything together?
I recommend using a simple decision framework.
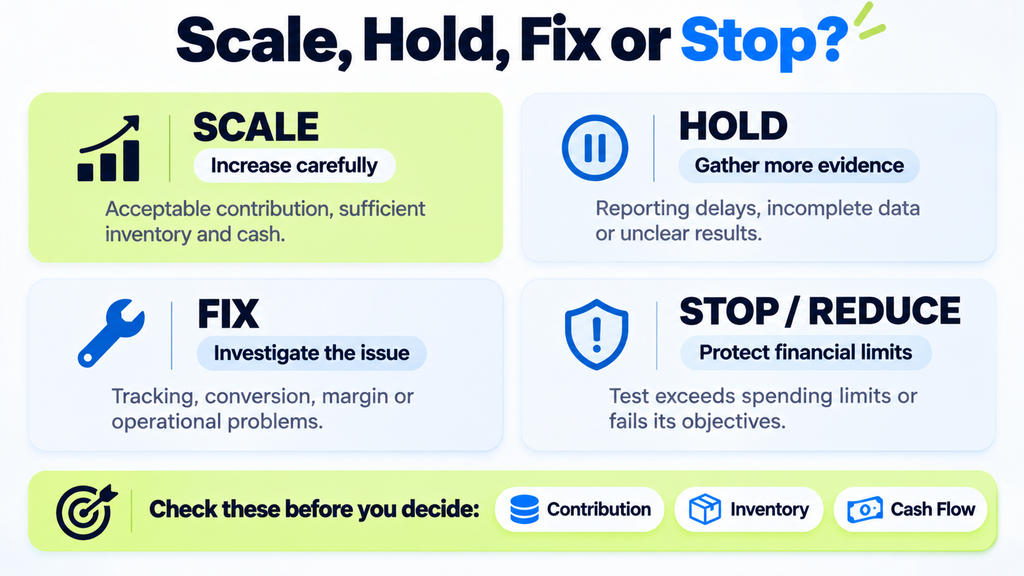
| Decision | When to consider it |
|---|---|
| Scale | Additional spending is producing acceptable contribution, with enough inventory and cash |
| Hold | Data is incomplete, conversions are delayed or the results need further investigation |
| Fix | Problems exist with tracking, conversion rates, product margins or operations |
| Stop or reduce | The campaign or test exceeds the agreed financial limits or fails its objectives |
For example, imagine a campaign has experienced a sudden drop in reported ROAS.
Should you pause it immediately?
First, check whether conversions are being recorded correctly.
Also, verify whether there were changes in product availability, offers or the website checkout process.
Sometimes the best decision is to investigate the problem before changing budgets.
What Should Your Ecommerce Scaling Dashboard Include?
Your reporting dashboard should help you make decisions.
I recommend including:
- Net sales
- Advertising spend
- Return on Ad Spend
- Number of new customers
- Customer Acquisition Cost
- Contribution before advertising
- Contribution after advertising
- Observed return from additional spending
- Refunds and cancellations
- Inventory availability
- Cash flow limitations
You do not need a complicated reporting system to get started.
A simple spreadsheet with clear definitions can help your team make better decisions.
The important thing is that everyone understands what each number represents.
More Ecommerce Revenue Is Not Always More Profit
Performance marketing for ecommerce is not simply about increasing advertising budgets and generating more orders.
It is about understanding whether the additional sales are creating value for the business.
Before increasing your Google Ads or Meta Ads budgets, calculate your contribution margins and the maximum advertising cost you can afford.
Identify products with healthy margins, review your measurement setup and make sure your business can handle additional demand.
Most importantly, evaluate what happens when you increase spending.
Remember, more revenue is not the finish line. The objective is to grow your ecommerce business while maintaining healthy contribution, manageable costs and sufficient cash flow.
If you are planning your next campaign budget increase, start by calculating your product costs, acquisition limits and expected contribution.
Ecommerce Profit and Scaling Calculator
You can use a spreadsheet to calculate your contribution before advertising, break-even ROAS and the additional contribution required from a budget increase.
Your calculator should include:
- Product selling price and net sales
- Product and fulfilment costs
- Contribution margin
- Maximum advertising cost per order
- Break-even ROAS
- Current and proposed advertising spending
- Expected additional sales
- Contribution after advertising
- Scale, hold, fix or stop decision
This simple exercise can help you make better advertising decisions before increasing your budget.
Have you ever increased your Google Ads or Meta Ads budget and noticed that revenue increased but profit did not?
How did you identify the issue?
Do share your experience in the comments section. Your learning might help another ecommerce business owner or performance marketer.
Thanks a lot for your precious time. Have a great day!